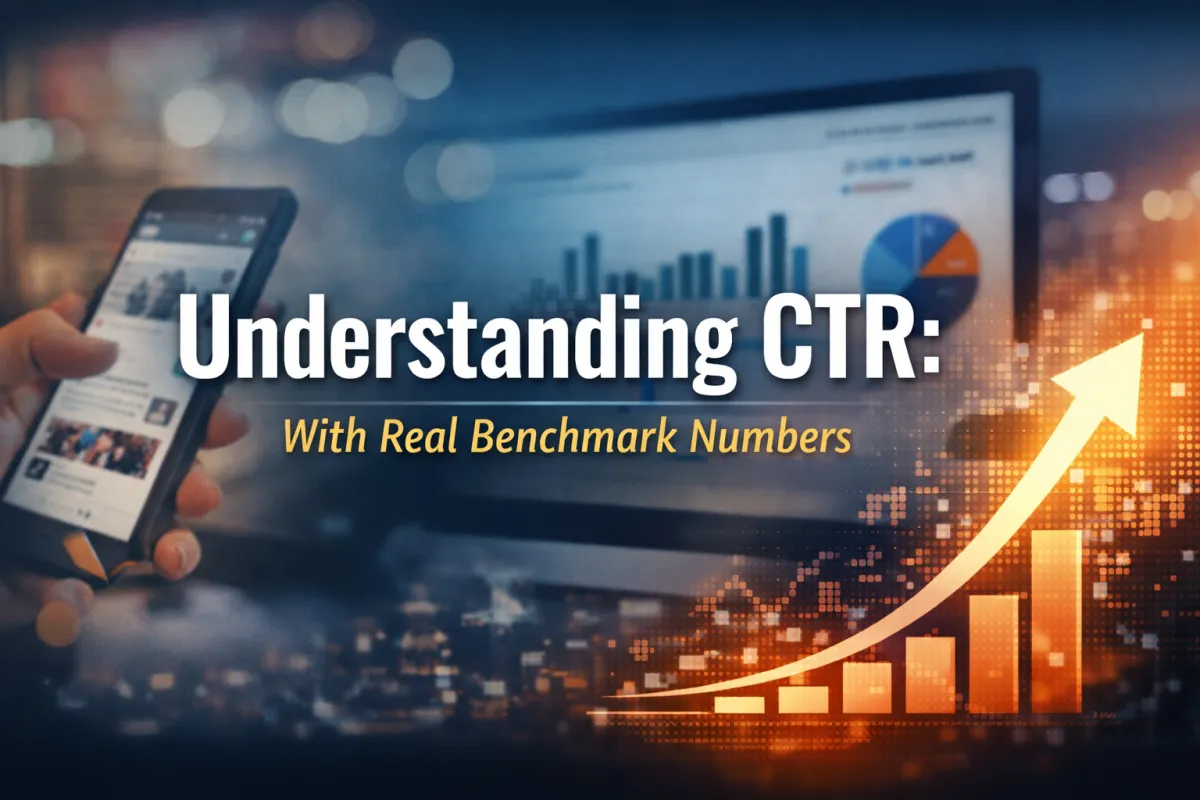
Understanding CTR—With Real Benchmark Numbers
Understanding CTR—With Real Benchmark Numbers
When you review Meta ad performance, one metric usually raises questions:
Click-Through Rate (CTR).
Many business owners see numbers like 1.5%–2.2% and think:
"That feels low—shouldn’t more people be clicking?"
The reality is that those ranges are normal—and often healthy—on social platforms. CTR measures attention at massive scale, not purchase intent. Let’s break down what the numbers really mean.

What CTR Actually Measures
CTR answers one simple question:
Out of everyone who saw the ad, how many were curious enough to click and learn more?
Your ads are shown to a wide mix of people:
Some who need your service right now
Some who might need it later
Some who are just casually scrolling
Some who are distracted or busy
Because of that, CTR is never 10% or 20%. It reflects real human behavior in a social environment.
Benchmark CTR Ranges to Use as a Guide
Across Meta platforms, these are realistic expectations:
Typical Performance
1.2%–1.5% – Baseline / acceptable
Ads are relevant, but creative or offer can be strengthened.1.6%–2.2% – Healthy range
Messaging and targeting are aligned; this is where most solid campaigns live.2.3%–3.0% – Strong performance
Creative, audience, and offer are working very well together.3.0%+ – Exceptional
Usually driven by highly compelling offers, strong video creative, or very warm audiences.
Why These Numbers Are Normal
Social platforms are interruption environments.
People aren’t searching for you—they’re relaxing, browsing, or being entertained.
Your ad has to earn attention in a split second.
Even getting 2 out of 100 people to stop scrolling is a significant win.

A Real-World Way to Picture CTR
Imagine 10,000 people in a room hearing about your business.
If 200 of them walked to the lobby to ask for more information, that equals a 2.0% CTR.
In person, that would feel like strong interest. Digital reports compress that behavior into a percentage, which can make healthy engagement look small.
CTR Is Only the First Step
CTR measures curiosity—not revenue.
The full journey looks like this:
Impressions → CTR → Leads → Appointments → Revenue
You can have:
A 3% CTR with poor-quality leads
A 1.6% CTR with highly qualified buyers
CTR simply tells us whether the ad is opening the door.
How to Interpret Your Numbers
Below 1.2%: The message or creative likely isn’t resonating.
1.6%–2.2%: You’re in the normal, healthy zone.
Above 2.3%: The campaign is performing very well.
Above 3%: Scale carefully—this is top-tier engagement.
The Right Way to Think About CTR
Instead of:
"Our CTR is only 1.8%"
Think:
"Hundreds or thousands of real people chose to learn more about us this month."
That’s what CTR represents—human curiosity at scale.
Bottom Line
CTR benchmarks feel low because we compare them to face-to-face interactions. Social advertising works across tens of thousands of impressions. Convincing even 1–2% of people to interrupt their scroll and take action is meaningful performance.
The goal isn’t a big percentage.
The goal is the right people taking the next step.
CTR simply tells us whether the message is doing its first and most important job.
